![]()
Reference: Template TD-9-3-8
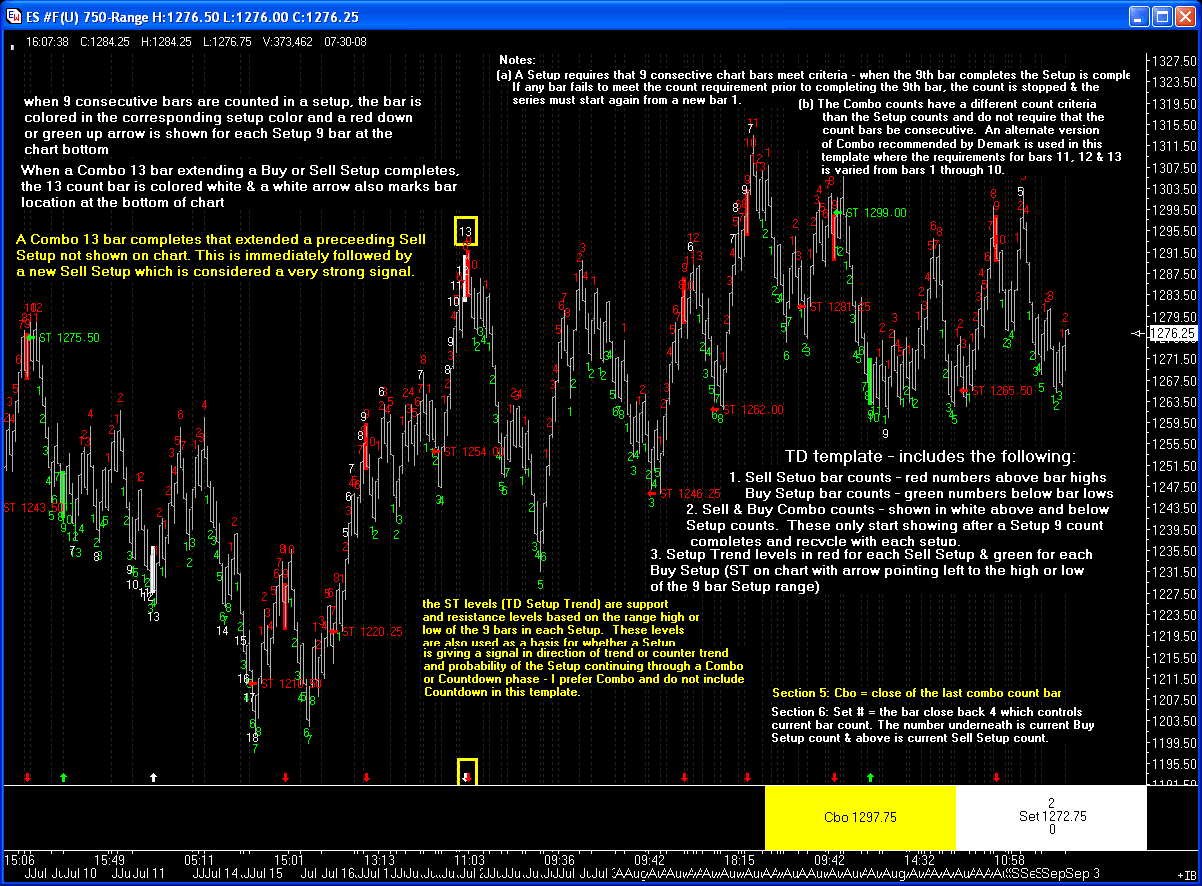
The reference template is shown on the following chart posted in dacharts_dachart_dacharts_dachart.com with notes describing the information developed and provided from the chart objects.

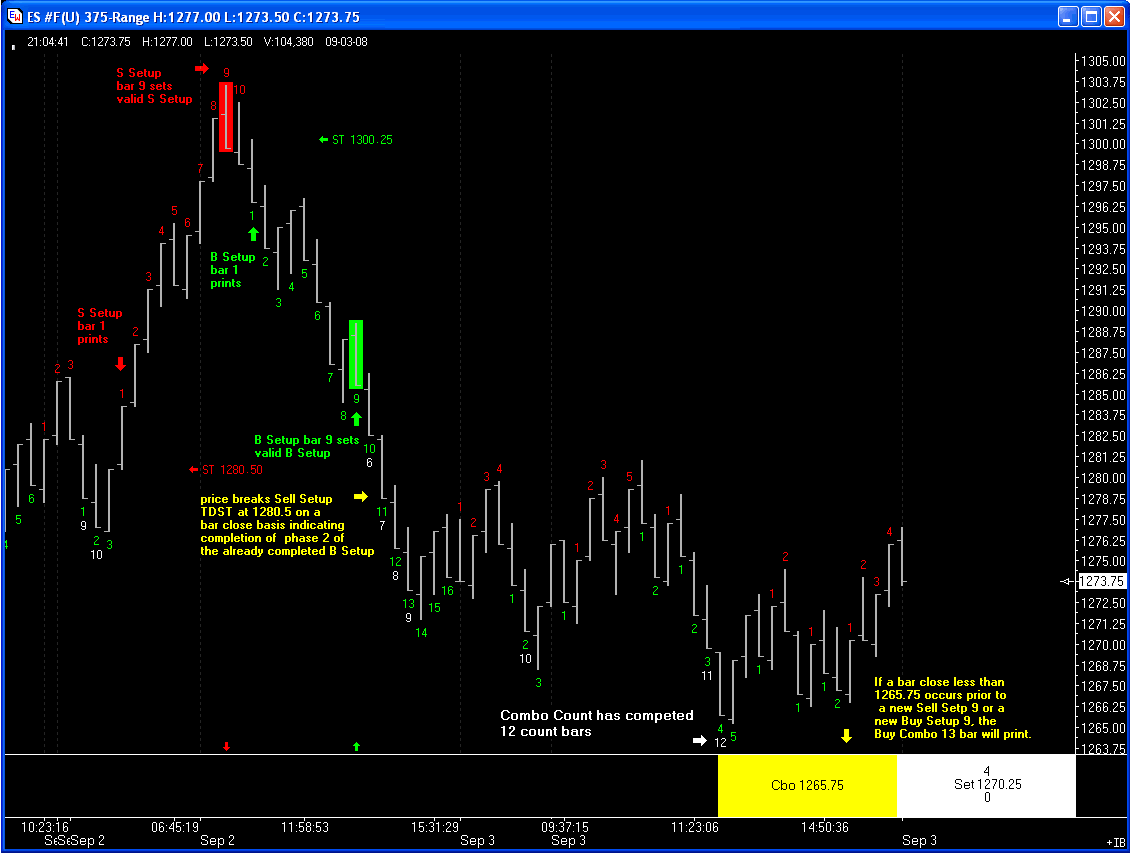
Same chart updated 9/03/08
More detailed view of counts etc.
The template provides 3 components of Tom DeMark’s TD Sequential and TD Combo indicators.
TD Sequential has 3 phases, Setup, Countdown and Intersection. In DeMark on Daytrading Options, DeMark states that intersection only applies to stocks and stock options and is not applicable to indices, financial futures, commodities and currencies where only the Setup and Countdown phases are needed.
The referenced template is tailored to a personal preference for Combo over Countdown in identifying the extensions of Setup through the extension phase. Also, a second alternate for qualifying bars 11 through 13 recommended by DeMark is used.
The criteria for Setup and Combo are as follows.
Setup (Buy Setup will be described, for Sell Setup, the reverse of the following applies)
DeMark sees Setup as a powerful price pattern in itself and most often upon completion will coincide with some form of price exhaustion where the market is prone to a price reversal to some degree. DeMark states his findings are that within 4 bars following the 9 count, the market should experience some sort of price reversal or at least consolidation.
Combo (Buy Combo will be described, for Sell Combo, the reverse applies)
When a Setup completes the 9 th bar, the 2 nd phase is in effect. Of the 2 methods for the 2 nd phase, Countdown and Combo, my personal preference is Combo and only Combo is described. DeMark’s books describe in detail the components and alternatives, along with much more detail to qualifiers, disqualifiers, etc. than provided here.
Alternative for bar’s 11, 12 & 13
The recommended alternative requirement for bars 11, 12 & 13 is that upon completion of the Buy Combo 10 count bar all that is necessary to obtain the last 3 counts (11, 12 & 13) is to have a closing price that is lower than the close of the previous Combo Count bar’s close.
TD Setup Trend Line – TDST (template shows as ST on chart)
TDST gives an indication of the direction and strength of a trend for gauging whether a market will reverse in the relative time frame upon the completion of a Setup series or proceed through the 13 count Countdown or Combo series. The TDST levels are also used to identify market support and resistance levels.
Note: the following relates to the TDST of a Buy Setup only – reverse applies to Sell Setup TDST
A Buy TDST line is formed at the highest true high of the Buy Setup phase and becomes a resistance level regardless of the time frame and extends horizontally remaining valid until exceeded by price to the upside on a bar close basis and on the following price bar’s open.
If price is able to close above the Buy Setup’s TDST level and then open above the level on the next price bar and trade at least 1 tick higher, it indicates sufficient strength that the advance should continue until a Sell Setup is completed (if not already complete) and the move up should proceed through completion of the 13 bar count continuation 2nd phase.
These are only basic elements of the Setup and Combo counts and TDST lines developed by the referenced template. To the best of my knowledge the data generated from the template is accurate.
For more information on using TD Setup, TD Combo & TDST along with other indicators developed by Tom DeMark, the following books linked in Amazon.com are suggested.
Also, the following are several internet links that may provide useful information on applying the DeMark indicators.
http://www.allbusiness.com/specialty-businesses/625909-1.html
http://www.etfdigest.com/TDSequential.pdf
http://www.researchlabtrading.com/public/382.cfm
http://www.researchlabtrading.com/public/department34.cfm
I have found the indicators in the template to be beneficial in supporting trades along with other confirmations for entries and trade management.
It is hoped that some can find this to be likewise of benefit.
Sincerely
Rin - 9/03/08