![]()
A tribute to Howard: Buy/Sell above/below 50% in Stx http://ensign.editme.com/stochastic
A tribute to Buffy: Stx 3 is like the Bline. Never trade against the direction
of the Bline.
A special thanks to Fibonacci's numbers. Every study or dyo is base on these
numbers.
This template is called “Fibo” because almost all the study numbers used are based upon Fibonacci numbers. The Stochastics, macds, retracements, trendlines and Hull averages all use fibonacci numbers which give correlation to the signals being generated. Use at your own risk!
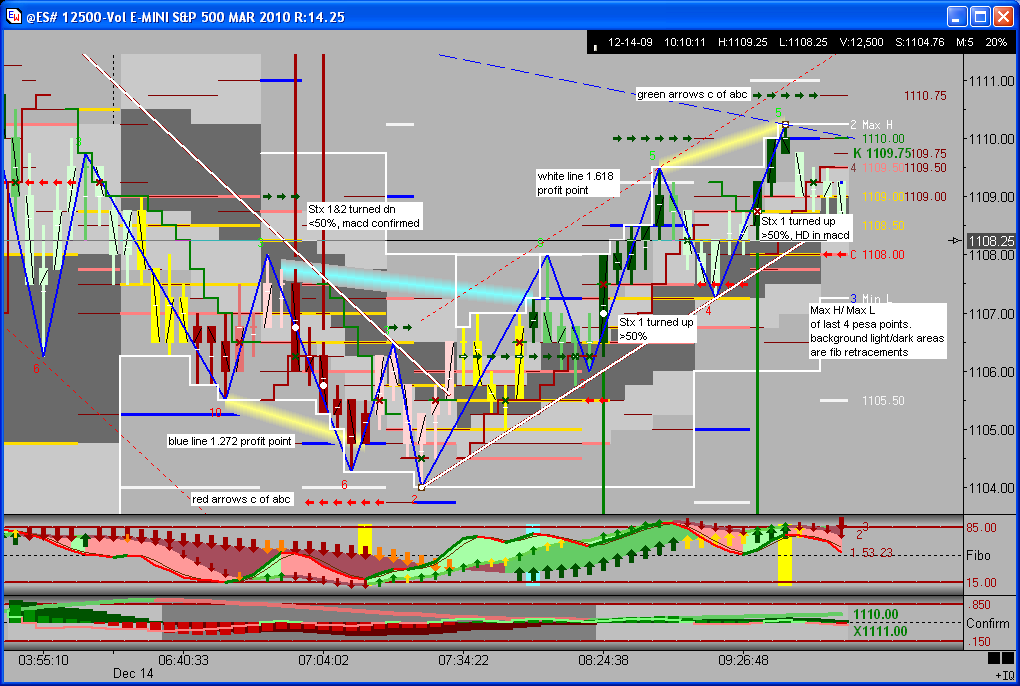
This template is based upon the Stochastic behavior article written by Howard Arlington ( http://ensign.editme.com/stochastic ). What I gleaned from the article is that a strong trend happens when a stochastic “turns up” above 50% in the stochastic window. This is because the 1st up wave in the stochastic window is usually a divergence as price makes a new low. The 3rd Elliot wave (or Buffy’s 1st push) then usually has a stochastic “turning up” above 50% in the stochastic window. This concept makes trading very simple, LOOK FOR A TURNING UP OF STOCHASTICS ABOVE 50%. Howard’s article uses an exponential stoch of 9/3/3 which you can change to if you like. I am using a Howard’s stoch of 8/5/2 which is very similar but, if I remember, is a little slower to give a safer signal. Since a turning up of stoch 1 could give a buy/sell signal, I have a “K” in the “right margin” which is the price forecast of %K turning up.
The other two stochastics are designed to imitate the next two higher time frames respectively. So if you are using a volume chart of 4750, then the second or next higher stoch is exactly what you see in the 9500 volume chart. The third stoch is exactly what you see for stoch one in the 19000 volume chart. This is important because I not only look for a stochastic “turning up” above 50% in the first stochastic, but all three. Also, the third stochastic is very close to the behavior of Buffy’s Bline. Therefore, for example, a long signal must have the 3rd stoch rising.
It is amazing that the macds using fibonacci numbers is very close to Buffy’s macd behavior in her templates. This is a great visual to confirm the behavior of the stochastics so I call the macd window “Confirm”. The template will not give a buy/sell signal unless the 1st macd is rising or falling respectively.
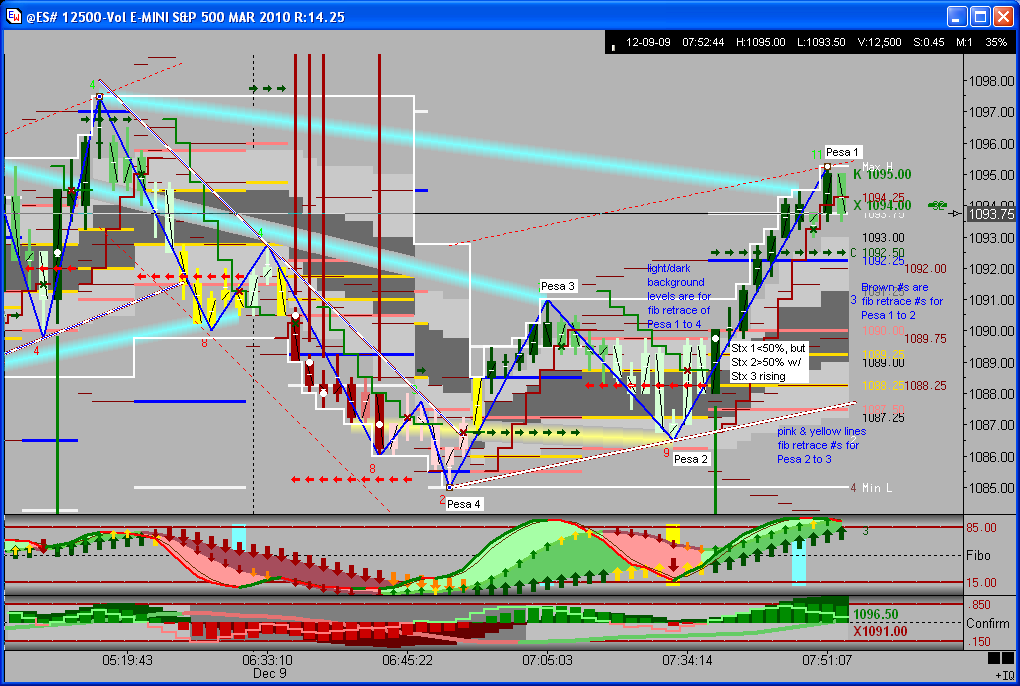
This template uses Fib retracements instead of moving
averages for overall trend. It is just my preference. The Pesavento Patterns
study marks the highs and lows of each trend or retracement and there are 3
sets of fib retracement numbers. Fib retracement between pesa 1 & 2, between
pesa 2 & 3,
and between pesa 1 & 4 (Max H and Max L). To see the numbers displayed,
you need to set the “right margin” in “chart properties” for
each chart to at least “98". My theory for trend is that pesa
4 must be trailing the pesa 1 and 2 either up or down. So the dyo “LT
trend” must have price >or< a fib retrace of .78 and rising or
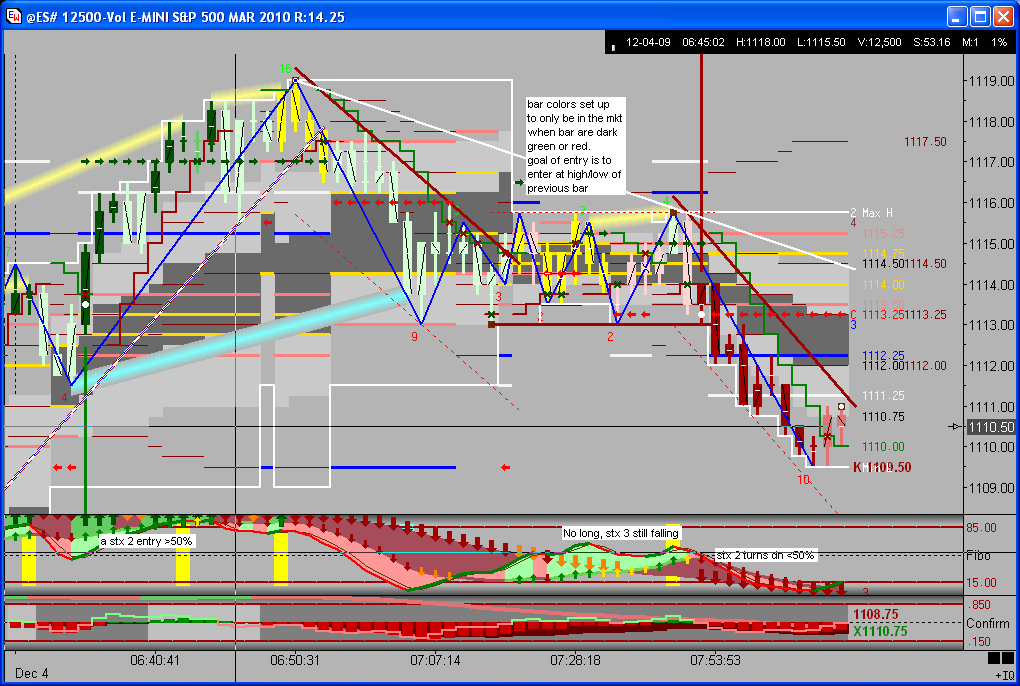
falling. This will turn the bar colors to a light green or red for a visual
effect from the dyo’s “long trigger” or “short trigger” lines
A & B.
Also, for a trend to continue, price should stay above/below .78 retracement.
The bars stay either green or red in this condition.
Using this template is very easy, just look for a stoch to
turn up/down above or below 50% respectively. This could be stoch 1, 2, or
3. A stoch 2 or 3 turn up is the next higher time frame buy/sell signal). The
dyo conditions for the setups are in “Stx 1,2 trig up”, “Stx
3 trig up”,
or “Stx 1,2 trig dn”, “Stx 3 trig dn” based upon
the “MT lines up/dn” or “ST lines up/dn” dyos..
The template has a visual green/red vertical line and a “white dot” for
the entry price to shoot for. The pesa pattern marks the number of bars in
the current trend/retrace, so I use profit points based on the bar number of
the entry. Usually a retrace will be between 3 and 7 bars, and a trend will
be between 5 and 9 bars or higher. So if I get a buy signal at the 5th bar,
I look to take profits at a profit point marked by the blue 1.272 or white
1.618 lines on the chart. If the entry signal is a bar 3, then I can follow
the Hull average trailing price. You can figure out the best way to exit by
your practice with the template.
Also, if the buy/sell signal is within the yellow .618 or pink .78 retrace
lines, I am more confident that the trend will continue. If the buy/sell signal
is above/below the pink .78 line, then I might think about passing on the trade
as the profit is usually small or a loss. This also could correspond to the
stoch being near the buy/sell zone in the stoch window.
This template uses the “Charts” to “Trade Detail” that will show the profits/losses for the day or total chart generated by the buy/sell signals. The exit points used are only the trailing stop, but the important numbers I look for are the “average win” and “average loss”. If the chart you are using is not giving an average win of near or about 2 times the average loss, then look for a different volume chart to follow. I have created a template called “Vol @ 3 min” to put in a day chart that will give the average volume of 3 minutes over a period of 21 days. I use volume charts for this template but it seems to show profits in any time frame.
If you have any questions, you can catch me in the Bline room of eChat from
Ensign Windows. By the way, Ensign Windows is the greatest chart program on
the earth and this template was designed to be used in Ensign Windows. Good
Luck.
DYoung