![]()
The purpose of this change is to add higher time frame information to the
chart.
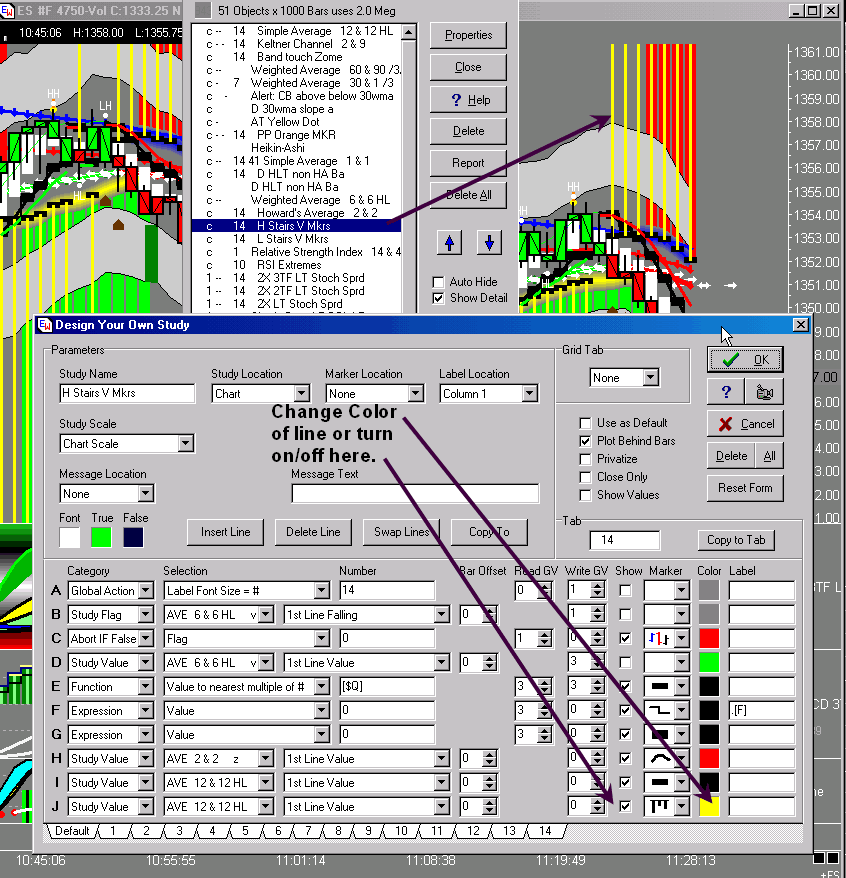
Adjust colors or turn on/off:
For the Main Background (Chart #1):
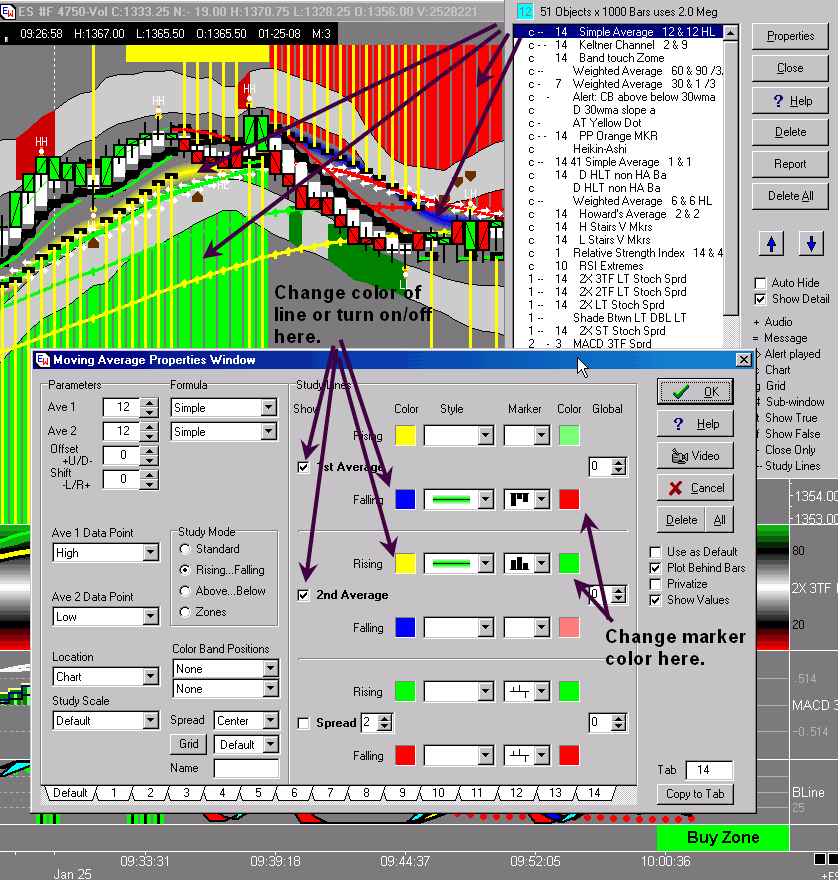
For the thiner lines (Chart #2):
For 2x Study Window (Chart #3):
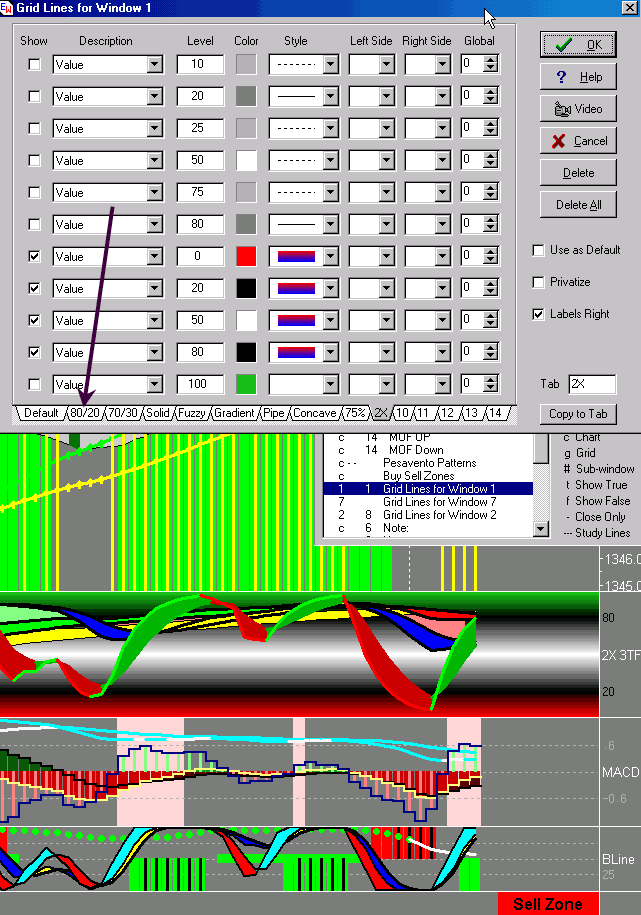
To save these changes to a tab:
Bring up Grid Lines for Window 1
Click on "Copy to Tab" button
Click on an unamed tab.
------------------------------------
The general idea is to watch for the thin yellow lines to appear by themselves
and then take a trade in the direction of the main background color.
We are not adding something new. What we are adding is higher time frame information
on the lower time frame chart.
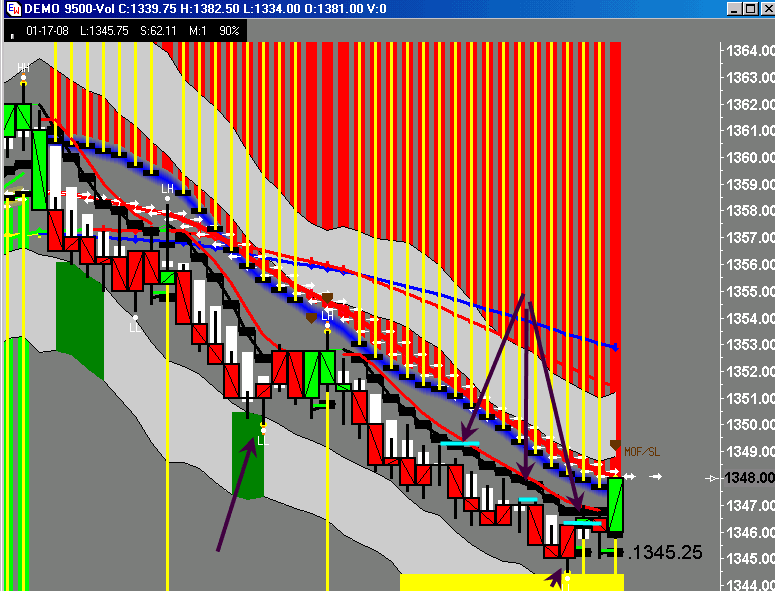
Chart #4:
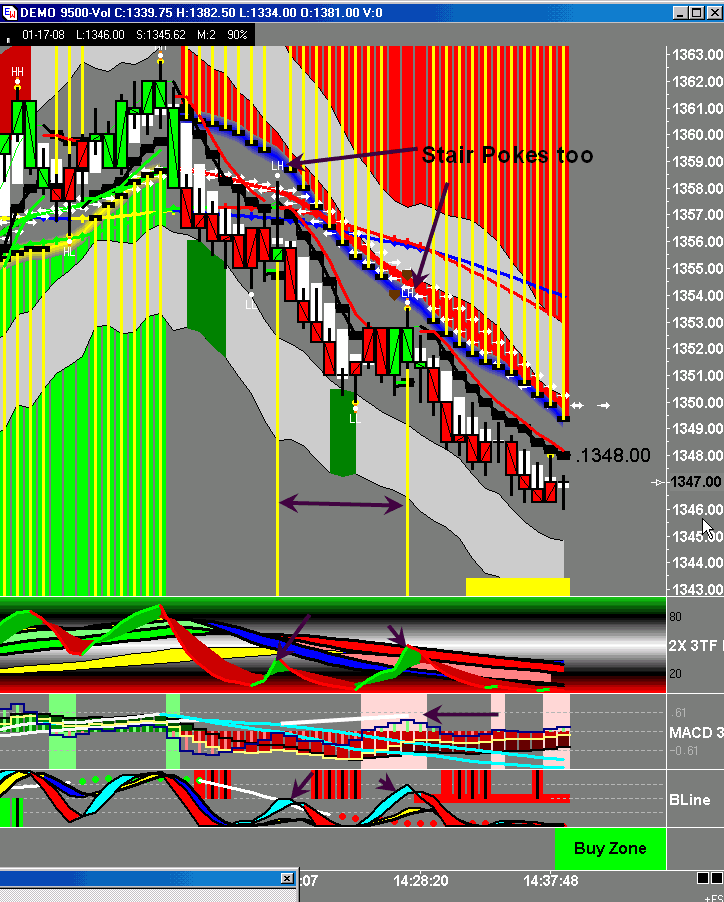
Both Setups:
1. The background is red -- higher time frame is in downtrend as price is below
the blue pipe line. (12SMA of Hs and Ls)
2. This time frame is in a downtrend as price is below the red 30wma with the
arrow showing there is slope on it.
3. Price is below "stairs" (6 WMA of Hs and Ls) and we are looking
for a short.
4. There is space between the 12 SMA of Hs and the "stairs".
Setup One:
At the first stair poke and thin yellow line (there can be more than one),
you will note the following:
1. Price made a LL which gives permission to look for LH. With red background
and 2x, bline and ribbons all coming out of sell zone, look for when.
2. 2x LT Stoch is fat - fat is good
3. MACDs have a red wall (two higher TFs below zero) showing two htfs are also
trending down
4.. Bline has slope to the downside with ribbon divergence (fast and slow ribbon
not "together") for first sell falling Bline.
This is a typical setup for an MOF even though the MACD window doesn't have HD
and isn't asking if you want to go short. Everything else is a go.
Setup Two
At the first stair poke and thin yellow line (there can be more than one), you
will note the following:
1. Price has made a LL.
2. 2x dbl LT stoch is fat showing downtrend strength on higher TF.
3. MACDs still showing red wall and asking if we are interesting in shorting
with the pink vertical band and also showing HD. (Price making lower high and
MACD making a higher high.
4. Bline is flat with ribbon divergence and sling setup forming.
Entries (Chart #5):
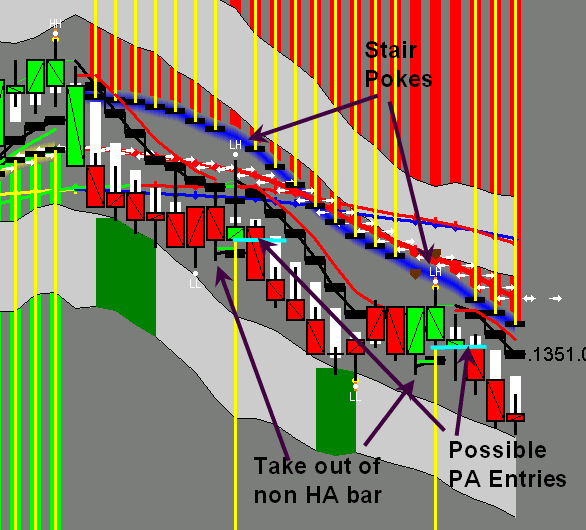
The aggressive entry is the stair poke.
The conservative entry is a take out of the non HA bar.
Price action entry is usually in the middle.
Exits (Chart #6):
These are really trader preference. Some criteria that can be used:
1. Tag of Keltner Band.
2. Take out of non HA bar.
3. Take out of close higher than open in downtrend (reverse for uptrend)
4. When you are thinking more about the money you have made GET OUT. Charts can
no longer talk to you with your focus gone.
The lower arrows point to the close higher than open taken out.
The upper arrows show the lines marking the non HA bars and where to lower stops
to.
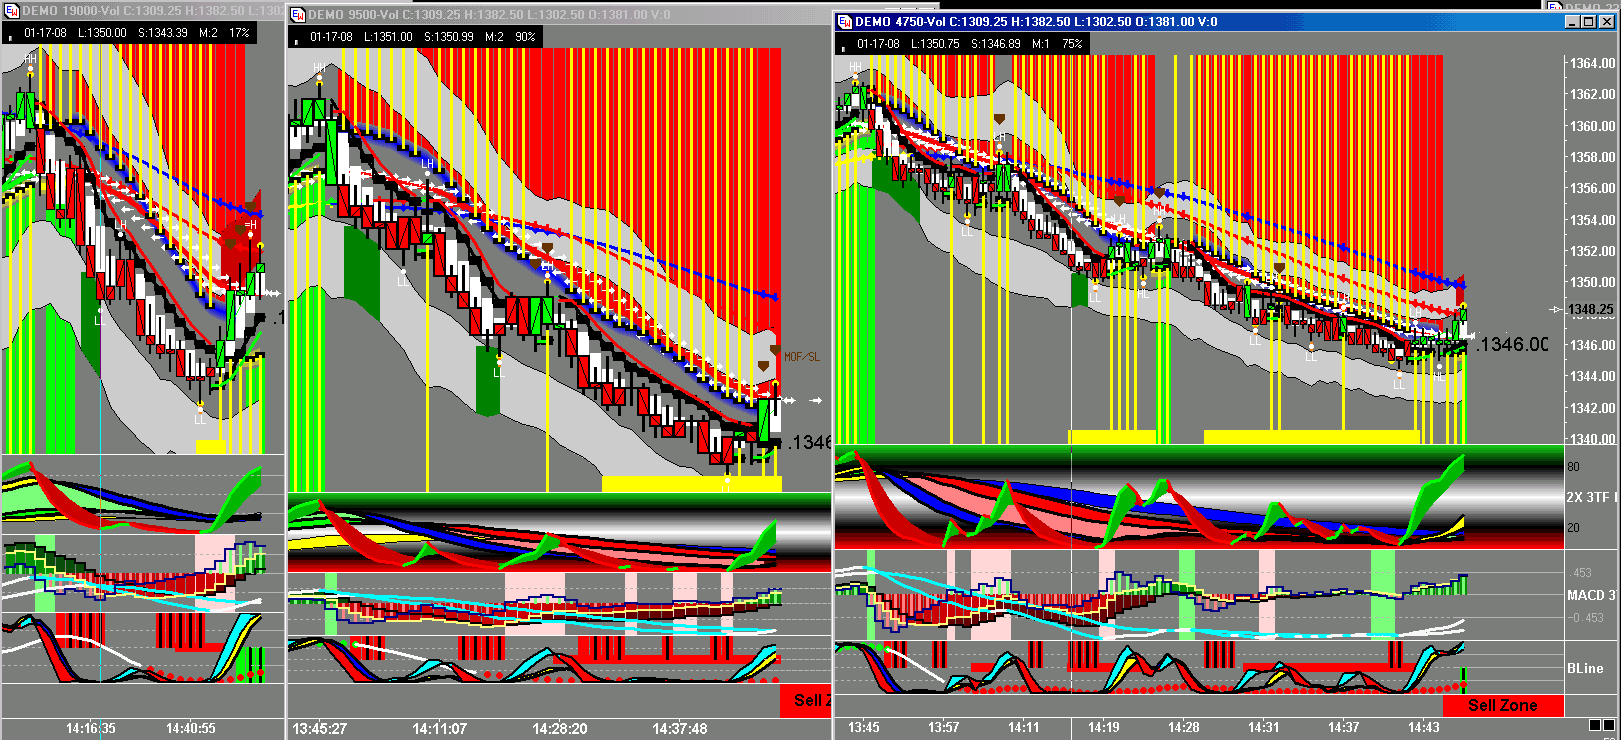
A multi TF snapshot of the trades (Chart #7):
Further information on the 2xBline system can be found at (Chart #8):
http://www.dacharts_dachart_dacharts_dachart.org/archives/2X_Bline_HA
1/28/08 "Buffy" Judy MacKeigan