![]()
Horizontal Scrolling in Ensign Windows
A number of people have expressed an interest in some “charts” that I have, which show various information scrolling across the chart window. I promised to show them how it’s done and to give a few examples of templates that they may find useful. This is the first of four templates that use the same basic technique.
Basic Trade Ticker
This is the simplest example and it is simply a horizontal version of a trade time and sales window.

The original implementation of this technique can seen here - http://www.ensignsupport.com/email/1688.mhtml .
The attached template shows the last 6 trades volume and price, constantly scrolling from right to left across the “Sections” at the bottom of the Ensign chart window (individual trade times can also be shown, and its quite easy to do). Section 7 at the extreme right hand side simply shows whatever static data you would like – in this case it’s the volume filter size and the bar time.
To change the filter size simply go to the “fonts” DYO and change the number in Line I to whatever value you want. Only trades with volume greater than that value should then be shown in the ticker. Clearly, if you want to see all trades then put this value to zero.
The color should change to red if the trade goes off at the bid or lower, and green if at the offer or higher.
I would recommend to uncheck the “optimise speed” box in your chart properties -
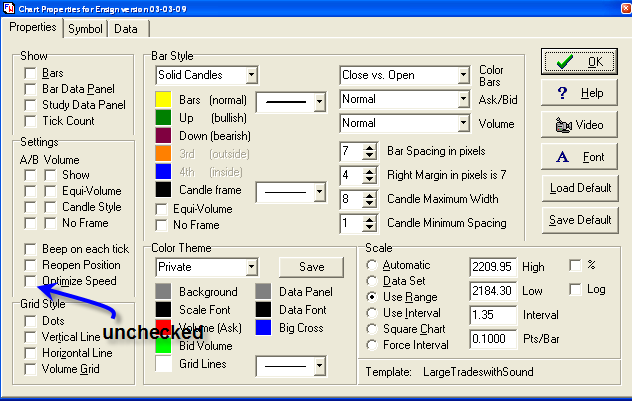
If you don’t do this you will not see multiple consecutive trades going off at the same price. Similarly I run this with “day session” unchecked in the chart symbol properties, so that I get a feel for the pre-market.
Otherwise, that’s it.
Sniffy