Below is a link with some additional information on the Kase CD indicator:
The author makes this statement on page 4 of the paper:
"...we have discovered a signal that historically generates a reliable
signal 95 percent of the time. This is when a KCD divergence is accompanied
by a PeakOscillator divergence. We find in these cases that 95 percent
of the time the market reverses significantly enough to warrant taking profit
and 60 percent of the time enough to have a significant trade in the opposite
direction in the same time frame."
It would be nice to have the Kase CD available in Ensign, especially with
such favorable odds for a trade to succeed when divergence takes place.
On the same page 4, the author compares the Kase CD favorably to the MACD:
"...the KCD looks virtually identical to the MACD histogram upon initial
review. However, it has extreme advantages in that it is highly reliable. That
is, we find the same 80 percent probability of success with an KCD divergence
as we do with the PeakOscillator divergence and PeakOut late in trend signals. Also
of great benefit is a much greater increase in stability in oscillations
and fluctuations around the zero line."
"This has two major benefits. First is an improved functionality
in divergence such that if we have instability around the zero line it is
difficult to pick the proper points for divergence for the highs and lows
on the oscillator. Second, many traders use MACD crossovers as entry
confirmation signals. If we have erratic behavior around the zero line
from time to time, this can cause multiple, painful whipsaws. With
the KCD, the zero line stability assists in the use of the KCD as a zero
line crossover signal as well."
I have studied the examples given of the Kase CD crossing the zero line,
and it appears that great majority of signals given appear to be profitable. I
hope this additional information on the Kase CD will influence its being
added to Ensign. Thanks for considering adding the KaseCD indicator
to Ensign.
Answer:
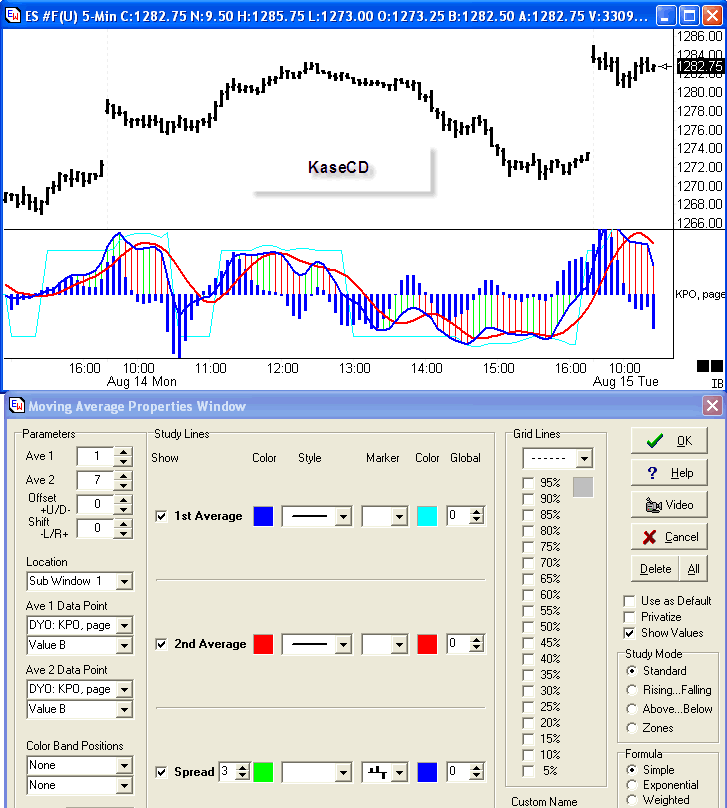
This shows putting on a Moving Average study and changing the Data Point
to reference the Kase Peak Oscillator DYO results to create the spread of Peak
Oscillator minus its Average. The KCD is plotted as the thick blue
histogram in the bottom panel.