![]()
Chart with No Slope Marker on BB2XMkrsFinal template:
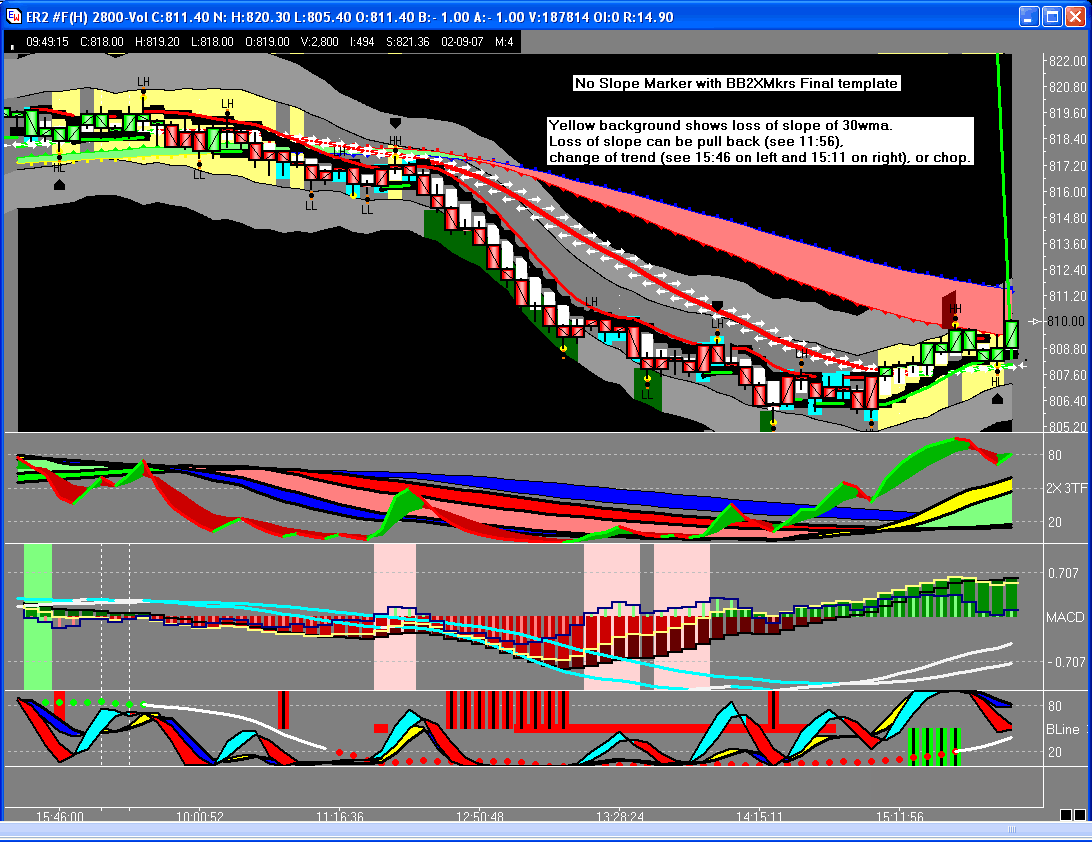
Chart with No Slope Marker stand alone:
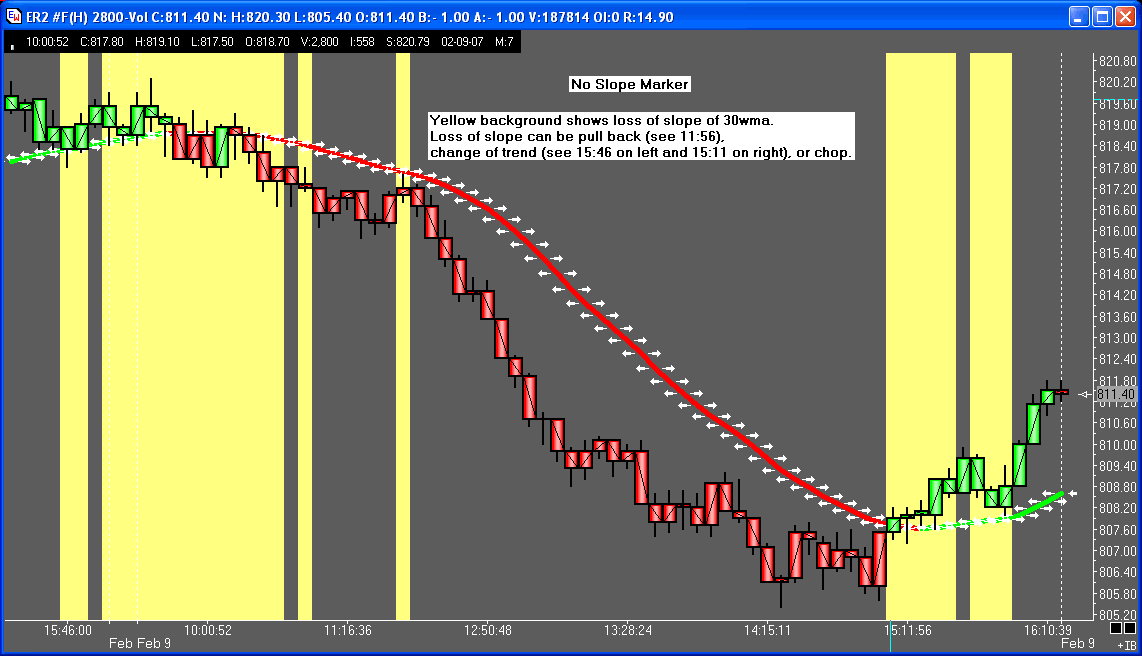
This template will add the No Slope Marker or it can be used as a stand
alone.
This marker provides a warning when the 30WMA loses slope. Loss of slope
can be a pull back, change of trend, or chop. The values for the current
and previous bar of the 30WMA are compared and the yellow zone marker is
displayed when the difference falls within the specified range. The range
can be adjusted for different time frames. The color can be changed.
Property window:
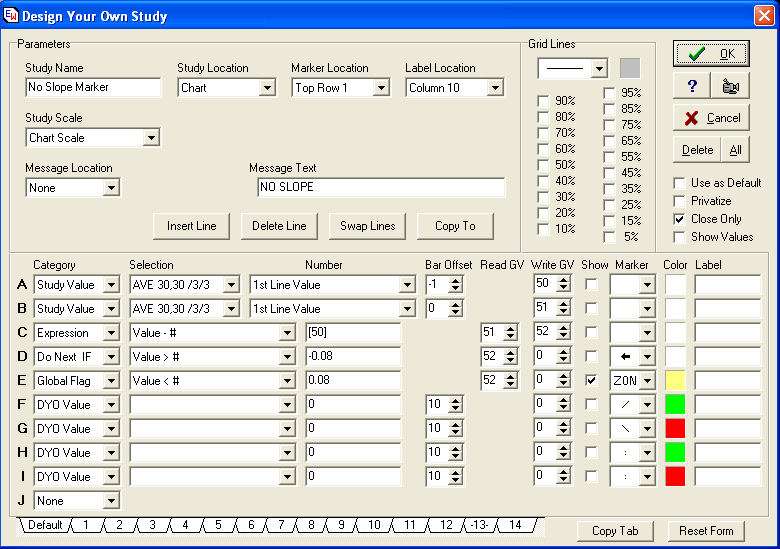
Line A and B are getting the values of the 30WMA for current and previous
bar and putting these respective values in GVs 50 and 51.
Line C subtracts these values from each other.
Line D and E specify the range of values that will cause the marker to be
drawn on the chart. The color can be changed by clicking on the color box
on Line E.
The numbers in line D and E need to be adjusted to fit your time frame. The
following is an example using the numbers I'm currently using for the
Russell:
| Volume Chart | Line D | Line E |
| 700 | -0.03 | 0.03 |
| 1400 | -0.06 | 0.06 |
| 2800 | -0.08 | 0.08 |
| 5600 | -0.10 | 0.10 |
Thank you, Sharon