![]()
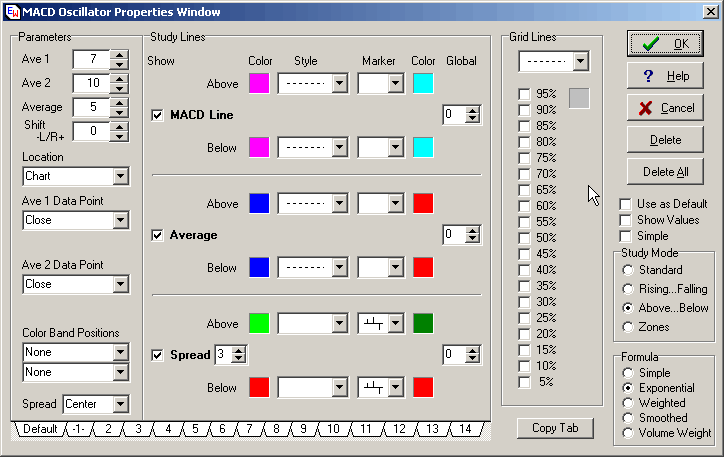
Explanation:
Properties window for MACD histogram with price
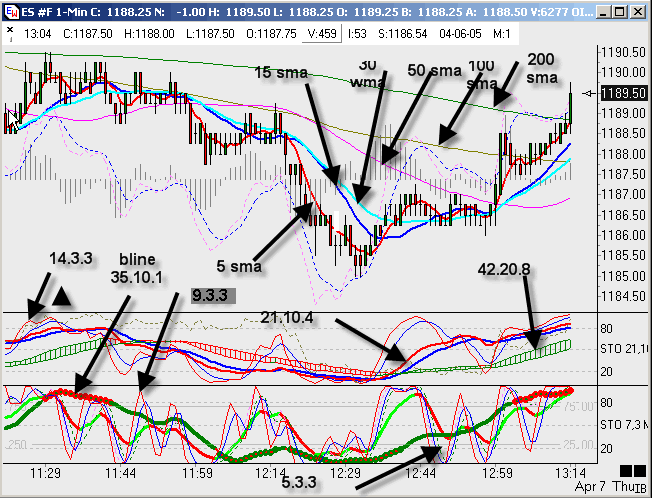
I use this template on the 1M-3M-15M-45M-60M charts.
MAs in price window are often targets or resistance.
The 50SMA is usually very good but will often take a 2nd try to punch through
it either as support or resistance.
The lower windows follow the normal 2XBline rules.
The first study window is the way I see 2X
The second study window is the Bline