![]()
AD Template After observing the Advancing minus Declining NYSE issues (AD) line for some time, I have made some observations that seem to support signals generated by other indicators, lending added confidence for taking those signals.
Like with any indicator, it is not full proof, but may add to the texture of other studies.
The symbol for the AD line is: JINT.Z for DTNiq feed $ADD for Esignal Unavailable for IB
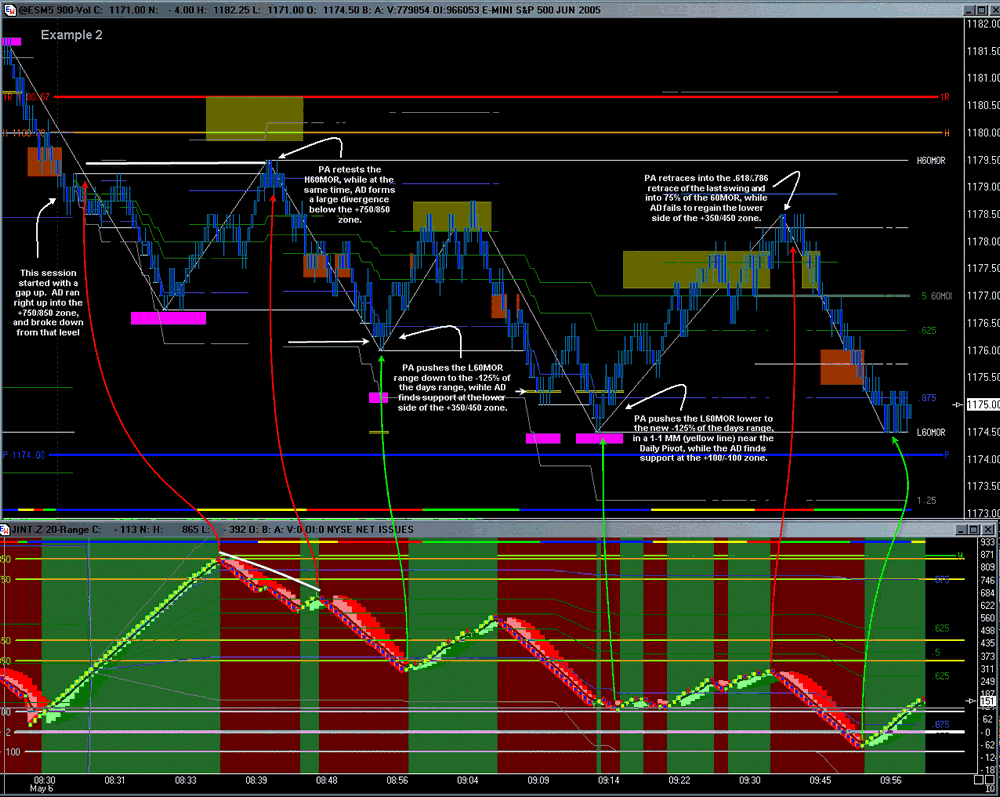
There appear to be zones that the AD moves between, similar to Support Resistance (S/R) ideas used with Price Action (PA). The daily price lines in the template outline those areas. Sometimes these zones act as S/R, sometimes consolidation areas, and sometimes they give way immediately. All of these can serve as background to an existing system of indicators. I keep the chart very small, and that is why it is brightly colored, so it catches my eye when there is a turn in the line. I also want to know if the A/D is near one of the zones, and its behavior in that zone. Viewing a larger chart, on the other hand, allows you to see divergences and spacial relationships better. As with any indicator, observe it for a while to learn its personality and relationship to your system of indicators. I have found that a 20R Time Frame (TF) seems to work the best for me. Play with the TF to find what you are comfortable with. Depending on the placement of the decimal in your Symbol Properties, that may equate to a 200R or 2000R chart.
Hopefully, by putting this idea out there, and with more eyes watching this, new and valuable observations will occur.
End of Description |
|---|