![]()
3 Jun 2003
Let's define what a slingshot is:
A slingshot is a pullback against an existing trend. For example, let's say that you have a strongly upwardly trending market. It would be only natural to see a little either profit-taking, or just reversal off of that upwardly trending market, because markets don't move, either straight up or straight down.
The purpose of the slingshot is to be able to identify those pullbacks against the trend, and then re-enter in the direction of the trend.
There are many different ways of defining trend: some people use the 20 EMA, some the 34 EMA, some 89 EMA - just a wide variety of different methods. What I have found that works for me is to define the trend as the direction of the 34 EMA. I am not saying that the others won't work, or don't work; just that I and others have found the 34 EMA to be the best measure of trend.
Now, the CCI (commodity channel index) is used to see the slingshot. We use two different CCIs, overlaid onto each other. The CCIs are identical, except for the length. One CCI has a length of 14, the other (commonly called the turbo), has a length of 6.
So basically, the three indicators used are: the 34 EMA, and 1 CCI with a length of 6, and 1 CCI with a length of 14.
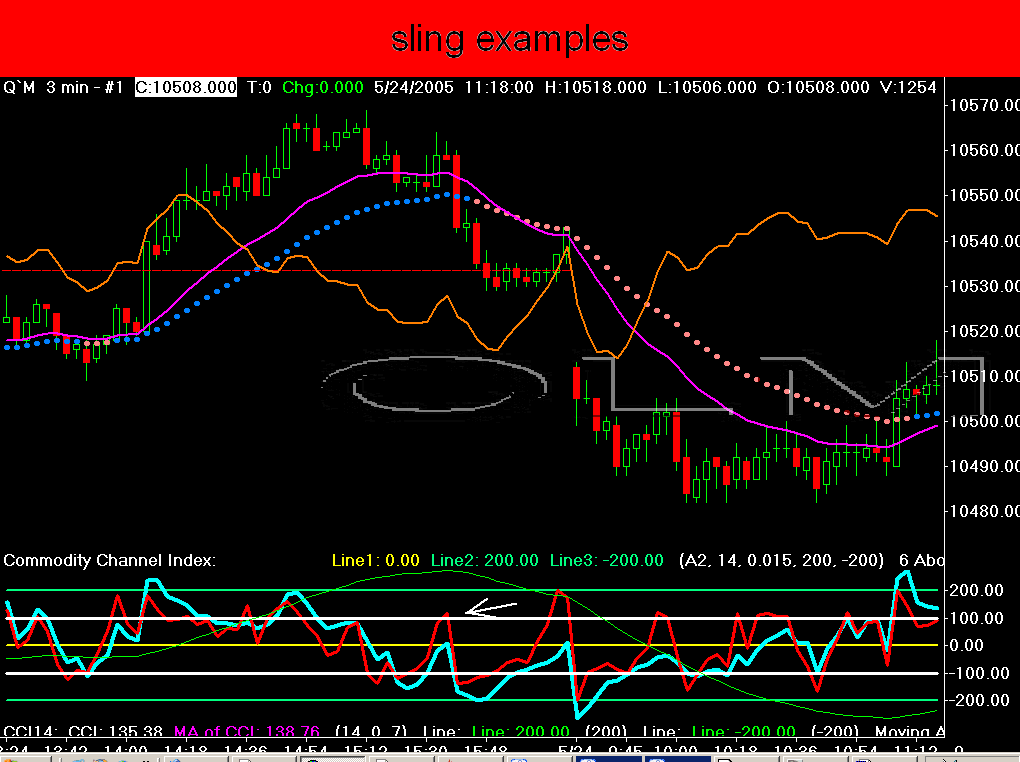
Now, let's assume, for the sake of argument, that we have an upwardly trending market, and then we get a correction within the 34 EMA uptrend. Typically, to get a slingshot, the turbo CCI goes down to the minus 100 level, and the 14 CCI goes to the 0 line. This is a slingshot set up for a long trade.
Now, I have been asked many times if the numbers have to be exact. what we are looking for here is the basic pattern, not exactitude. In other words, the CCI 14 can turn around in what is called the zero line zone. Now that is where the CCI 14 has a value between plus 33 and minus 33. Correspondingly, the turbo CCI doesn't have to go to exactly minus 100; it can go minus 110, minus 120 - you get the idea. What I have found essential is to have about 100 points between the turbo and the CCI 14.
Now typically, I use a 3 minute chart to identify slingshots. This is because I use IB as a data vendor. Now, if I were using a data vendor that sent out all the ticks, which IB does not, then I would be looking at a 233 tick and a 3 minute chart.
I used the 175 tick on Sierra, due to the fact that the Sierra tick chart
is really a combination of a tick and a one minute chart. But for Ensign users,
I would just look at a plain old 233 tick chart and, of course, the
3 minute.
This is just my way of doing it. Slingshots work on all time frames. I have seen them on 5 minute charts, 10 minute charts, 13 minute charts, 30 minute charts, daily charts, etc.
Ok, how to enter on the slingshot. Typically, on a normal slingshot, you will
see a very distinct V on the turbo, at around the minus 100 area, for an uptrending
market. On the other side of the V is the re-entry long. Generally, I would
use a 2 point stop. Others would use different, but I certainly wouldn't use
less than like 1.25-1.5. It is just what I've seen that works.
Slingshots don't go on forever, just as trends don't. Generally, from what
I've seen, you can get either 3 or 4 good slingshots in a trend, using a 3
minute chart. This corresponds with the well-known market adage of 3 rallies
to a top and 3 drives to a bottom. After these 3 or 4 moves, I begin to get
very leery of taking another slingshot, because generally the move has petered
out.
One other thing, before I leave this first preliminary session about slingshots
and their theory: if you compare a 233 tick chart with a 3 minute chart, you
will generally see slingshots on the 233 tick chart that
you won't see on the 3 minute. This is because the slingshot that you can see
on the 233 tick chart will, on the 3 minute chart, look more like a bull or
bear flag. but, either way, whether you use a 3 minute chart, or a tick chart,
the slings are there.
Hopefully, this has not been as clear as mud, and I am sure that there will
be questions. Please feel free to email me at olmtrader@tampabay.rr.com with
any you may have. Unlike others, I want to focus on things that CAN be traded.
Others look at these weird ESPX weekly charts, or monthly charts, or some goofy
thing that you can't trade. This is not my style. I want this to help others
generate real dollar profits.
olmikey
Chart #1
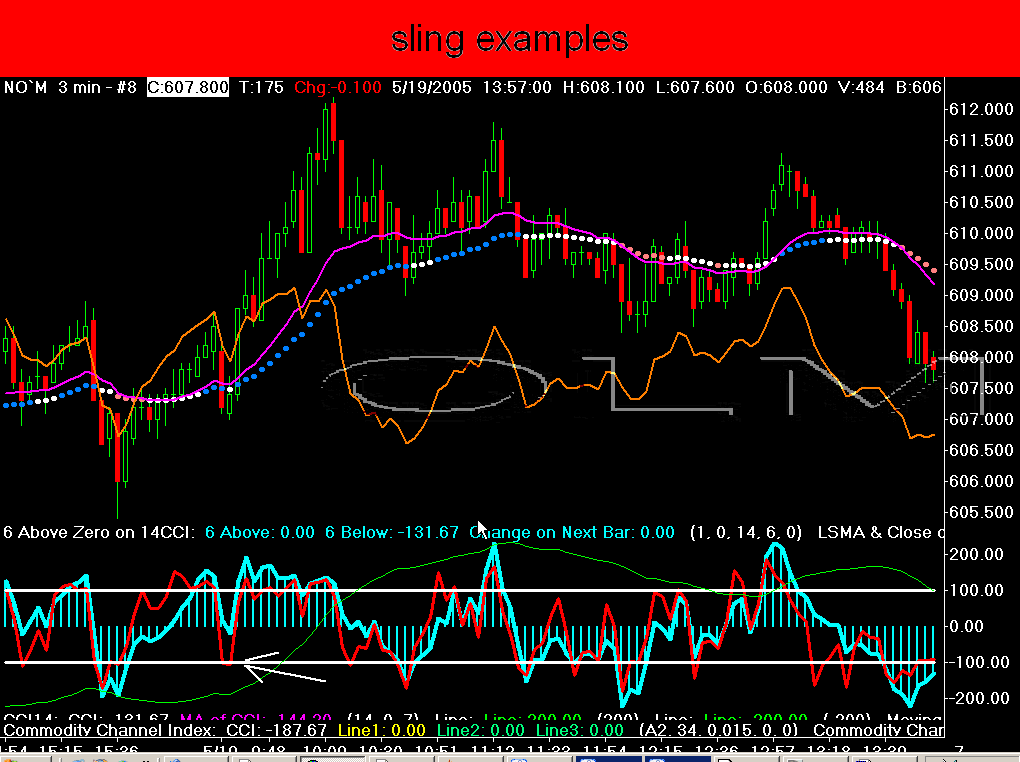
Chart #2
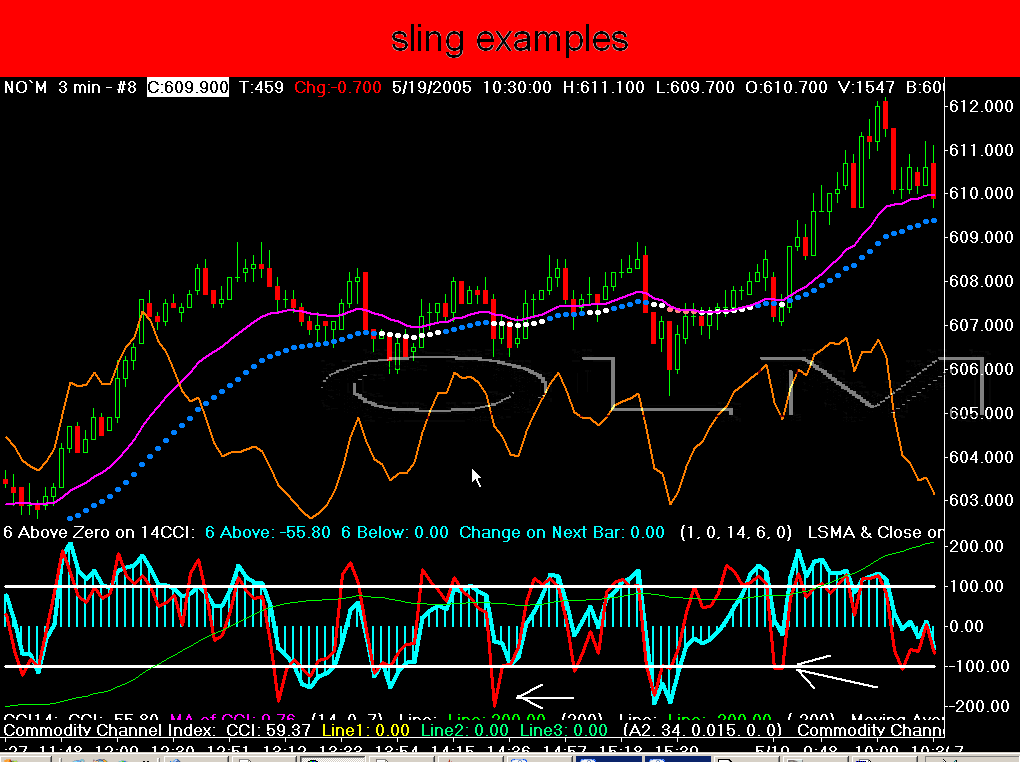
Chart #3
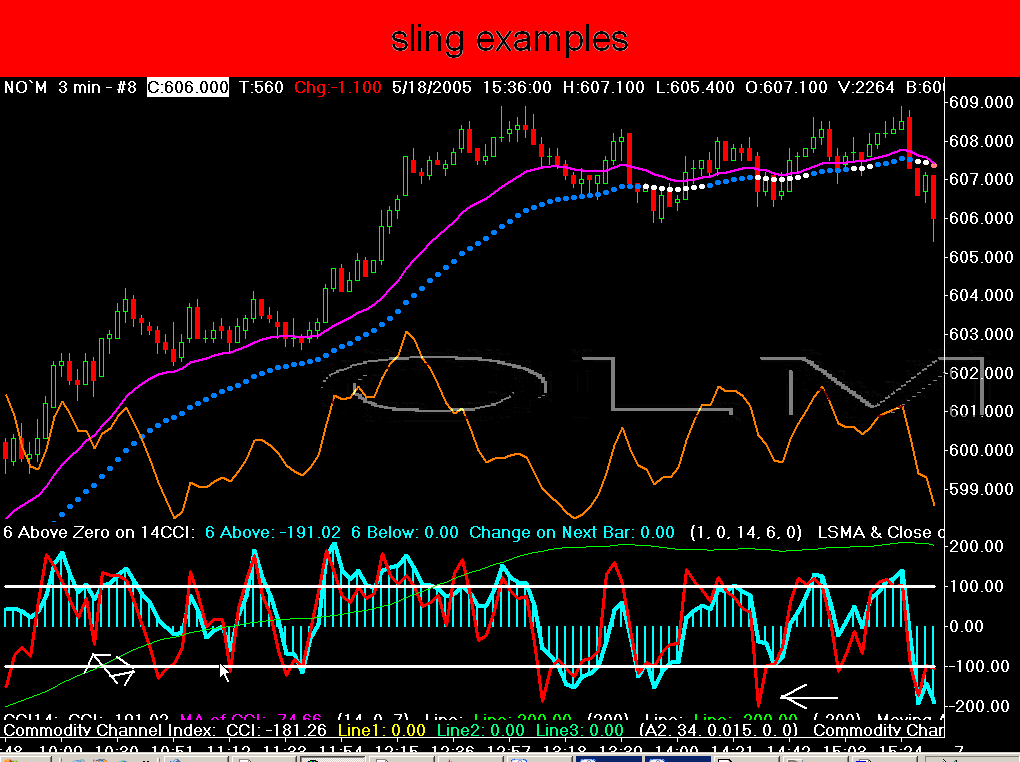
Chart #4
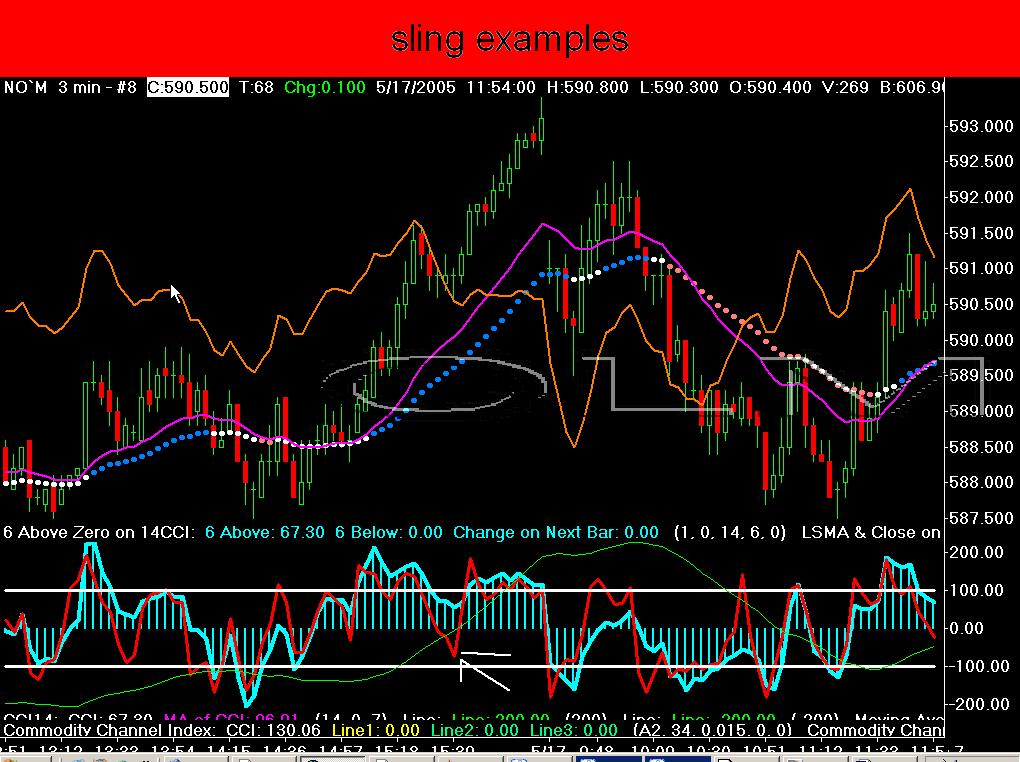
Chart #5
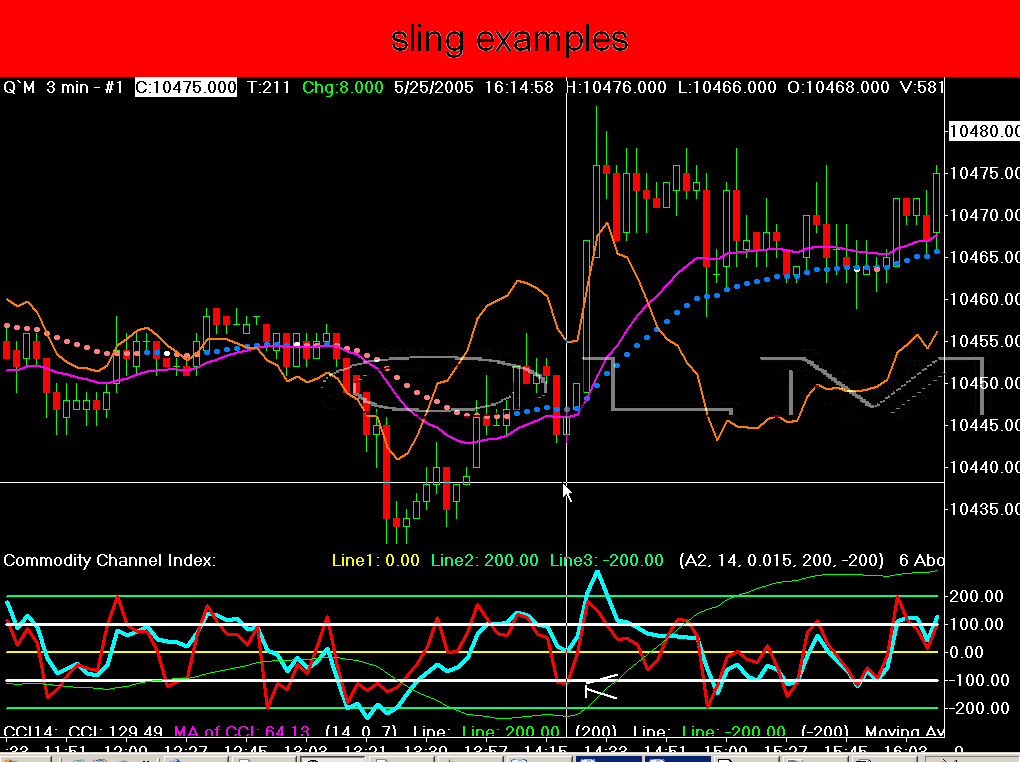
Chart #6
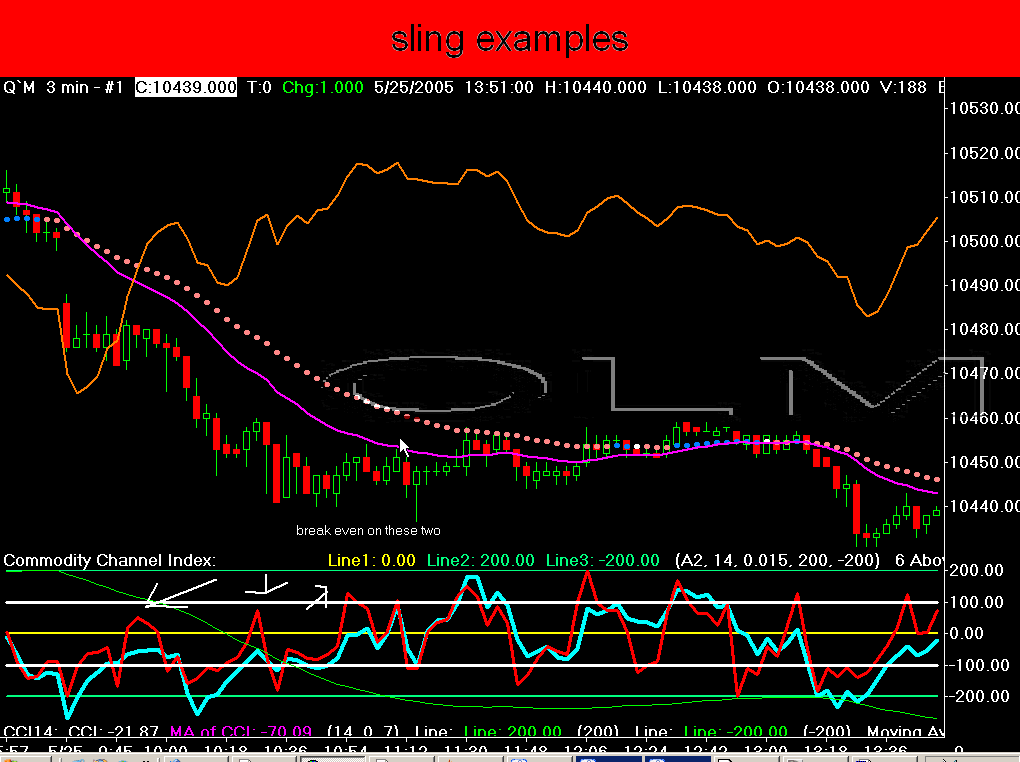
Chart #7